Kennis&innovatie stadsprocessen slim managen.jpg

Revealing the city’s rhythms in real time

Decisions surrounding the local energy transition, changes to infrastructure to deal with traffic congestion, homebuilding challenges on an unprecedented level... These issues impacting our physical environment require a long-term vision at the local level. We have no time to waste: we need to get started today. We need access to real-time data, not just to make the right choices and decisions, but also for the smart management of day-to-day processes in our cities. During the WeMakeThe.City event, Geodan launched the Amsterdam Smart City Dashboard together with its partners Huawei, the Johan Cruijff ArenA and the City of Amsterdam. The Dashboard is designed to provide access the overload of data traffic in a transparent way, as well as facilitating local and improved decision-making processes based on real-time data.

The state of the city at a glance

But how do you develop a smart, sustainable city? For its transition into a smart city, the City of Amsterdam has teamed up with the Johan Cruijff ArenA, Geodan and other partners. In recent months, it has also been working on its own Amsterdam Smart City Dashboard, which displays the current state of the city and its most critical processes at a glance. It is based on the three key elements for any smart city: energy transition, living environment and transport. Showing the various data within these elements instantly provides the City and its stakeholders with valuable information: about the current situation and, using reliable models and analyses, for the future as well. The predefined KPIs (Key Performance Indicators) help users to monitor and manage the system, because while setting objectives for the smart city is a good thing, measuring progress is even better.
Annita Vijverberg

Want to know more?

Annita Vijverberg

Please feel free to contact us. Annita Vijverberg is our expert in this field.

Email me

From open data to action

Technology and digitalization play a vital role in developing and managing a livable city. Large amounts of data become accessible every day, and individually this data cannot be used in a ‘raw’ format. However, by providing smart access to the data, visualizing it based on each element and analyzing it, we can create a coherent narrative for the city. This may involve anything from the use of cameras, traffic measurers and noise measurers to the growing use of social media. The Amsterdam Smart City Dashboard integrates all these available data flows in a transparent way and adapts them for use. This makes it possible to track and monitor specific urban processes easily and in real time within their own individual context, for example through live information for the public, as well as for the City itself in terms of monitoring and improving its own processes. It instantly generates control data and provides the City of Amsterdam and its stakeholders with considerable scope for action. In introducing the Amsterdam Smart City Dashboard, the City is taking an important new step: from data to information and to action.

Setting policy issues

Energy transition, living environment and transport are key policy issues for the City of Amsterdam. Yet issues and the attendant processes and activities vary depending on the focus and on local and regional problems. For example, the dashboard can be adapted to the challenges of each local government.

In introducing the Amsterdam Smart City Dashboard, the City is taking an important new step: from data to information and to action

Open standards were an important part of its development, making the dashboard vendor-independent. This makes it possible to link all potential data sources and sensors which are important for the City (ranging from current traffic activity and air quality to energy consumption), depending on urgency and focus. The dashboard can also be integrated with frameworks and clients such as BIM and GIS.

ENERGY TRANSITION

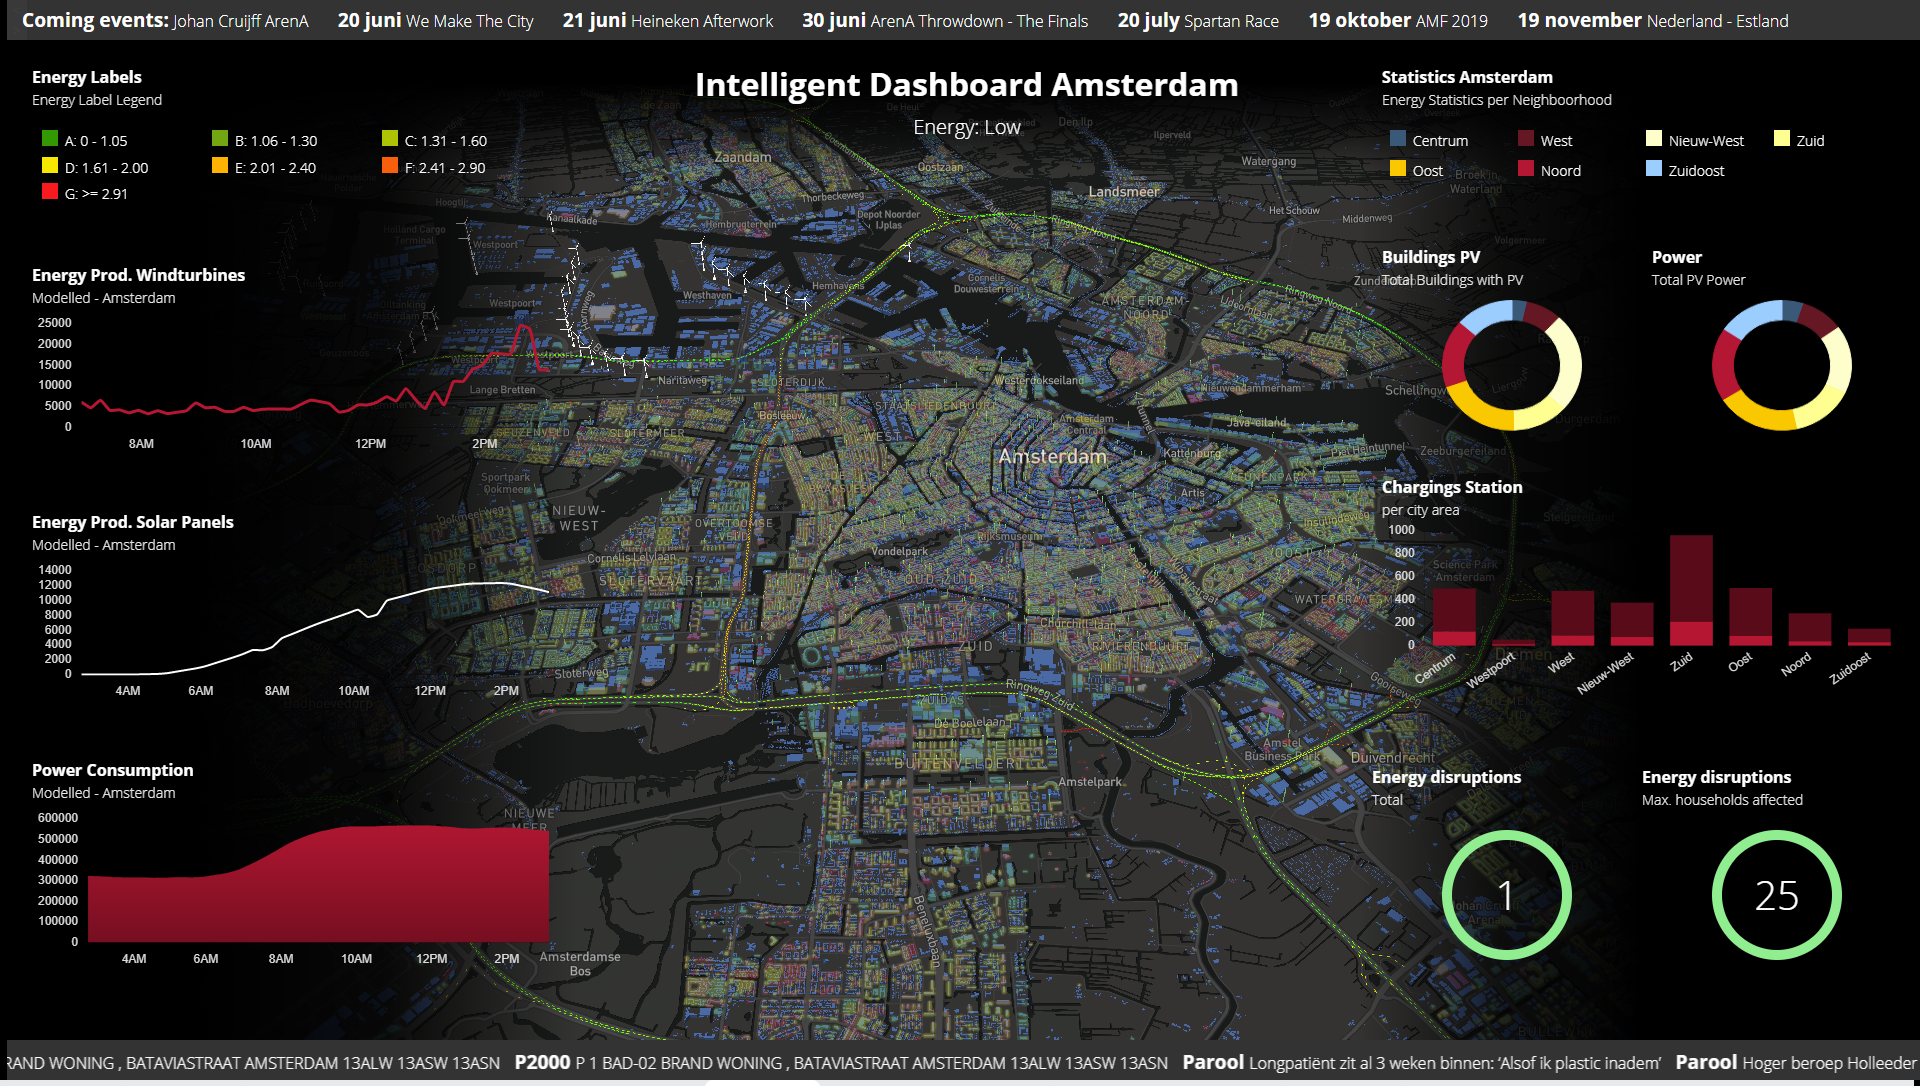
Will the City of Amsterdam be able to achieve its targets for the energy transition? Amsterdam’s carbon emissions will need to have been reduced by 95% by 2050 (versus 1990) and the city must be fully natural gas-free by 2040. The Energy Transition tab/screen provides more information, ranging from the macro to the micro level. It shows current yields from solar energy, along with the current availability of charging stations for electric vehicles, yields from wind turbines, and local energy disruptions.

TRANSPORT

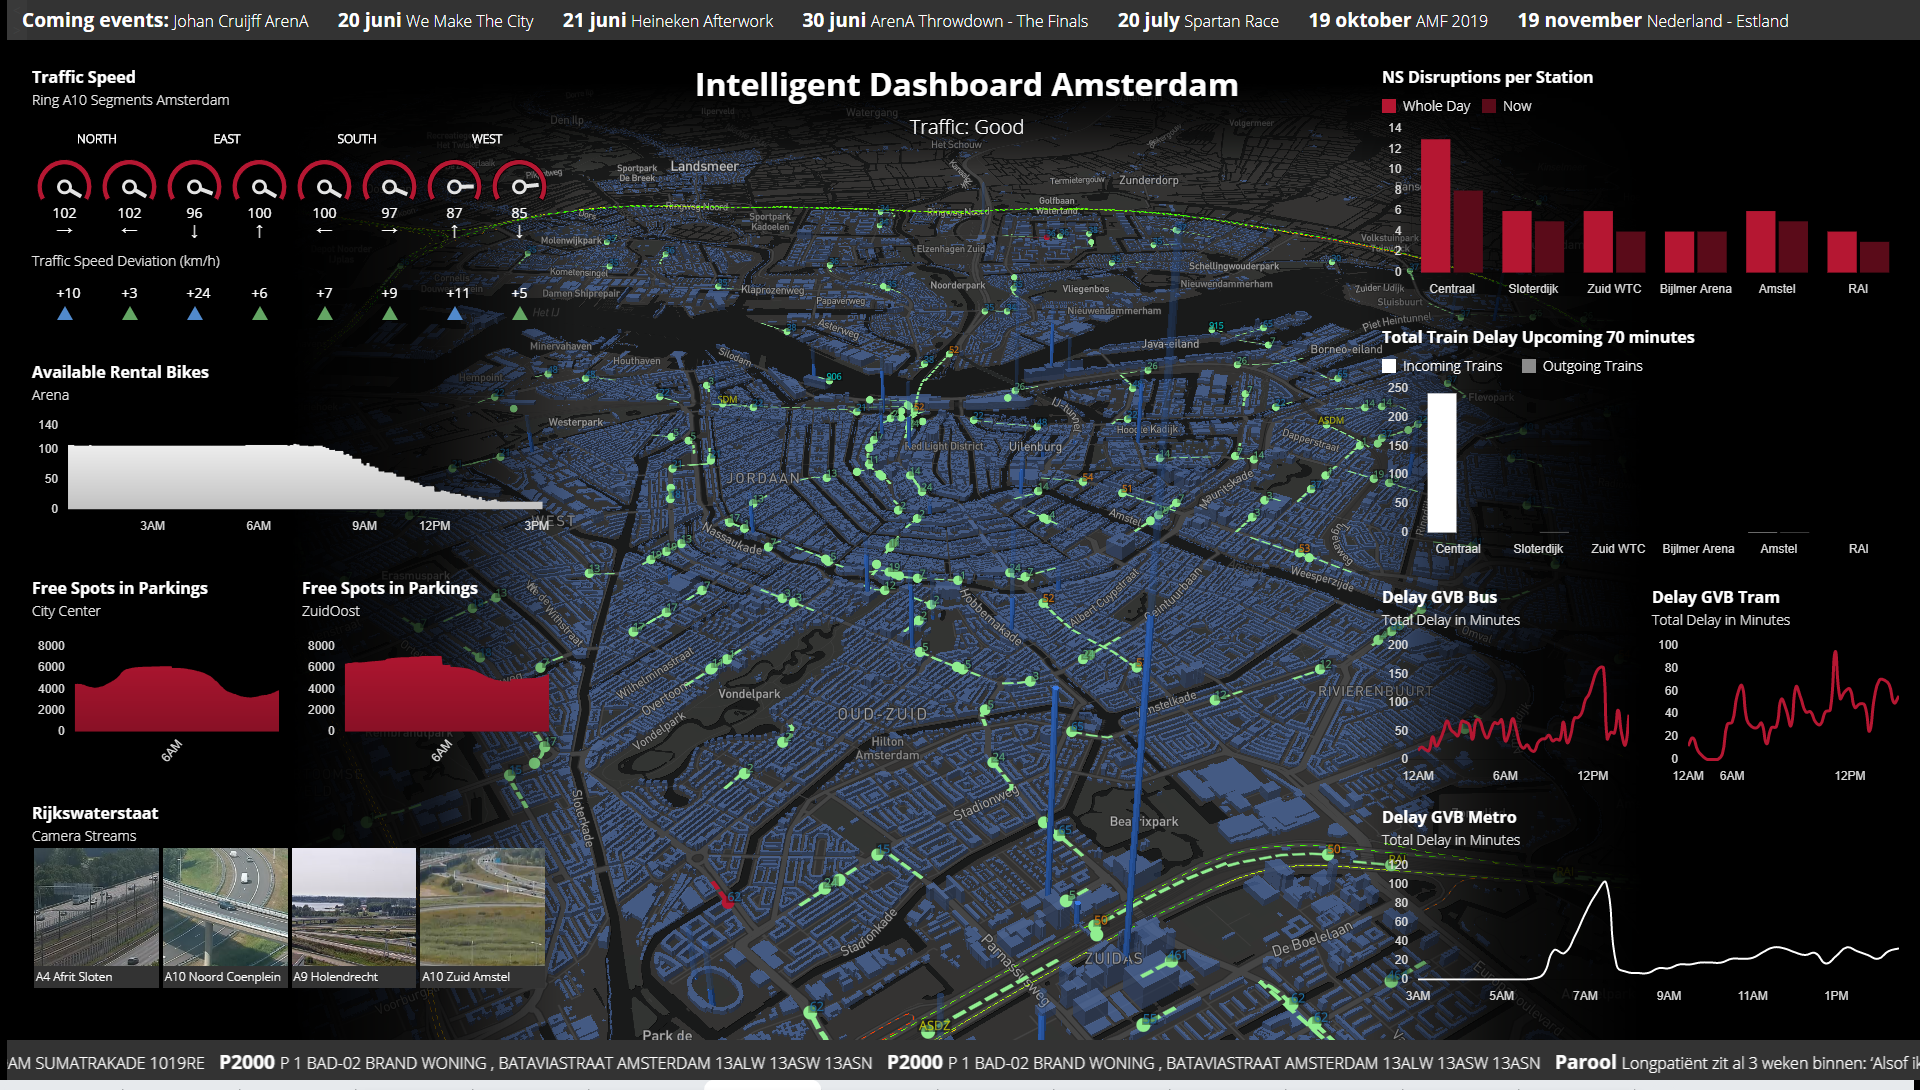
What is the current situation in Amsterdam in term of transport and accessibility? The city’s quality of life is being compromised as a result of the growing population and the ever-increasing number of visitors and tourists. The City has translated its objectives for improving traffic flow and the city’s accessibility into the Smart Mobility action programme. Transport issues are ideally suited for visualization in the Amsterdam Smart City Dashboard. The Transport tab/screen shows data flows for motorway traffic and public transport in real time: from speed on the motorways to the availability of public bike systems and from parking spaces in parking garages to public-transport delays.

LIVING ENVIRONMENT

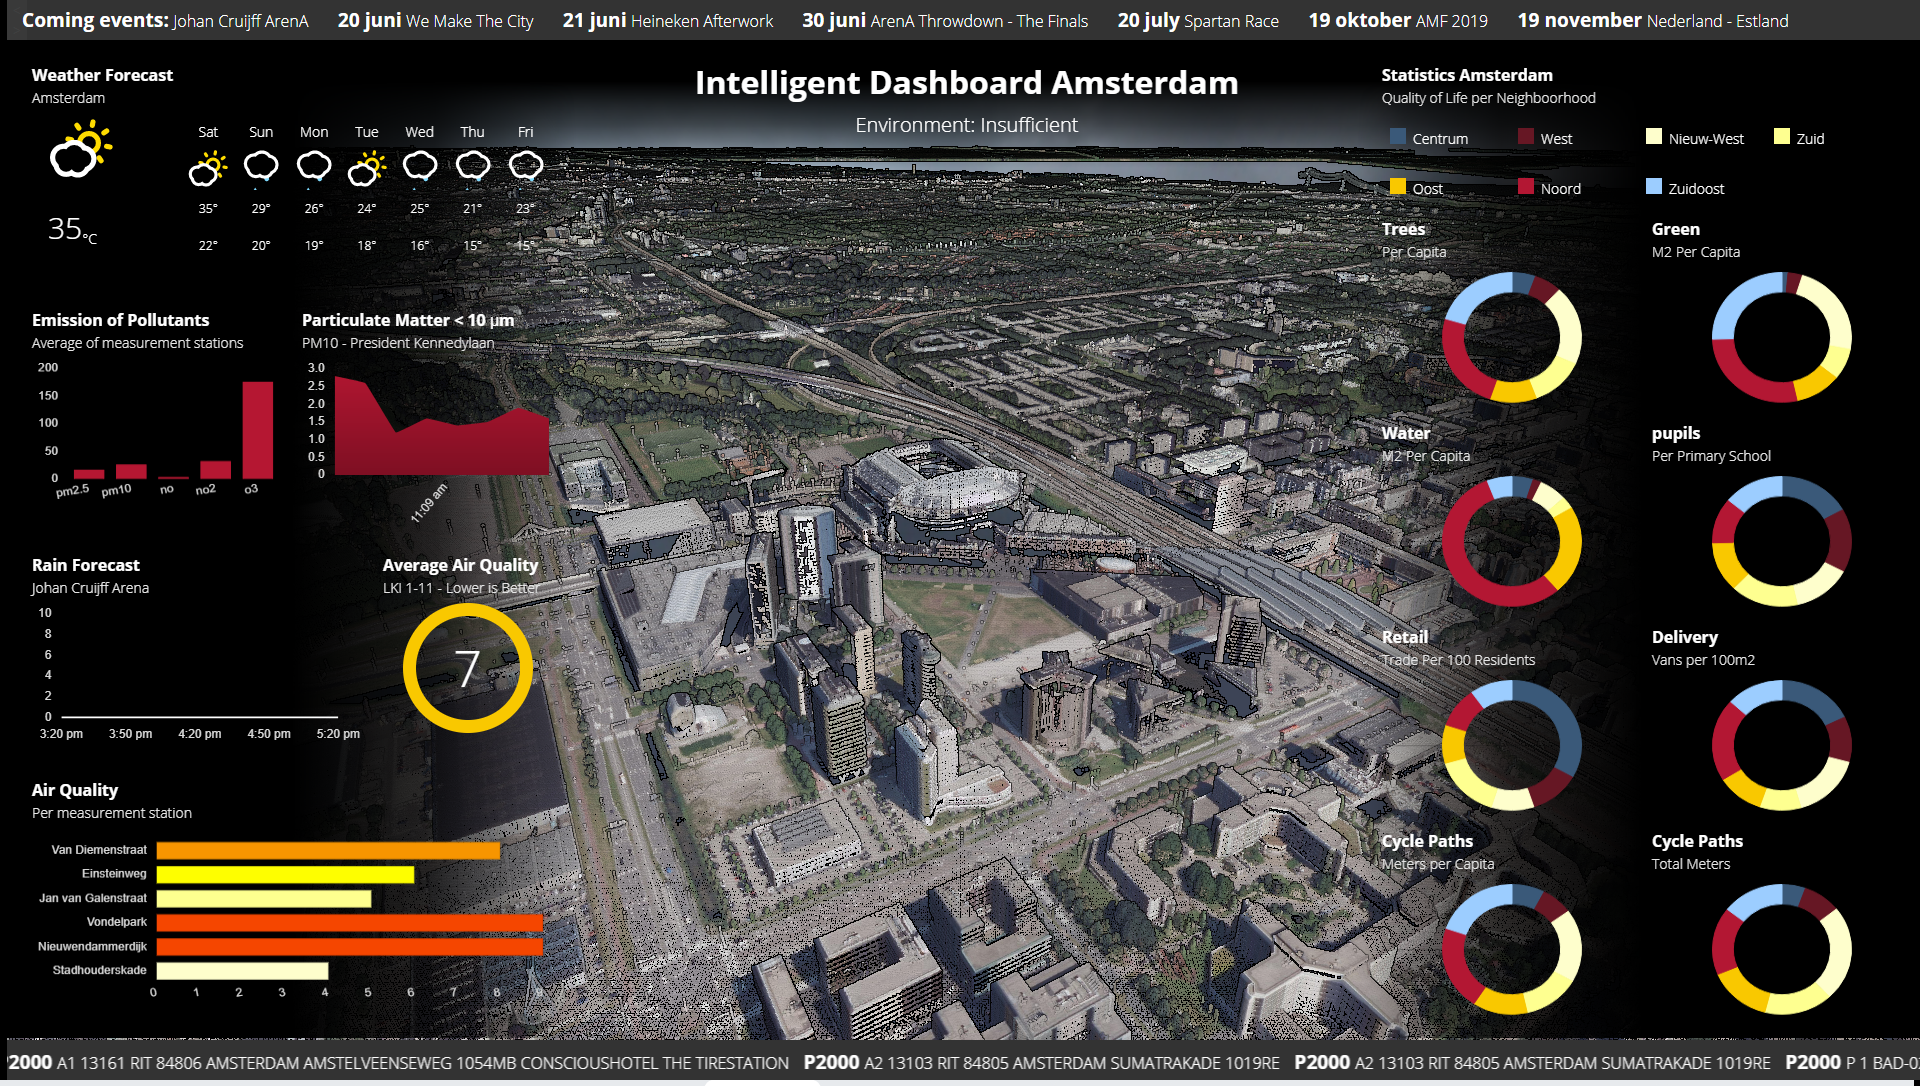
How do Amsterdam residents perceive their city? Essential amenities and facilities such as schools, shops, sports facilities and green areas contribute to the wellbeing of the city’s residents and the people employed there. However, dynamic factors such as air and water quality play a role as well. The ‘Living Environment’ tab/screen shows both dynamic and static data and the coherence between the two. In addition to this representation, this tab also enables users to wander through the city, allowing you to experience the city and its quality of life for yourself.